Feature Scaling- Why it is required?
Feature scaling can vary your results a lot while using certain algorithms and have a minimal or no effect in others. To understand this, let’s look why features need to be scaled, varieties of scaling methods and when we should scale our features.
What is Feature Scaling?
It refers to putting the values in the same range or same scale so that no variable is dominated by the other.
Why Scaling
Most of the times, your dataset will contain features highly varying in magnitudes, units and range. But since, most of the machine learning algorithms use Euclidean distance between two data points in their computations, this is a problem.
If left alone, these algorithms only take in the magnitude of features neglecting the units. The results would vary greatly between different units, 5kg and 5000gms. The features with high magnitudes will weigh in a lot more in the distance calculations than features with low magnitudes. To suppress this effect, we need to bring all features to the same level of magnitudes. This can be achieved by scaling.
Some examples of algorithms where feature scaling matters are:
- k-nearest neighbors with an Euclidean distance measure is sensitive to magnitudes and hence should be scaled for all features to weigh in equally.
- Scaling is critical, while performing Principal Component Analysis(PCA). PCA tries to get the features with maximum variance and the variance is high for high magnitude features. This skews the PCA towards high magnitude features.
- We can speed up gradient descent by scaling. This is because θ will descend quickly on small ranges and slowly on large ranges, and so will oscillate inefficiently down to the optimum when the variables are very uneven.
- Tree based models are not distance based models and can handle varying ranges of features. Hence, Scaling is not required while modelling trees.
- Algorithms like Linear Discriminant Analysis(LDA), Naive Bayes are by design equipped to handle this and gives weights to the features accordingly. Performing a features scaling in these algorithms may not have much effect.
following slide screenshot is taken from Andrew Ng coursera machine learning course where he shows how we converge to optimal value using gradient descent with out feature scaling (left) and with feature scaling(right).

Various methods of feature scaling:
In this tutorial, we will be using SciKit-Learn libraries to demonstrate various feature scaling techniques.
Importing the data
import matplotlib.pyplot as plt
import numpy as np
import pandas as pd
dataset= pd.read_csv("C:\data/data.csv")
dataset[:5]
As we can see that the column “Age” and “Estimated Salary” are out of scale, we can scale them using various scaling techniques.
Splitting the data
from sklearn.cross_validation import train_test_split X=dataset.iloc[:,2:4].values
# A matrix of all the independent variables
Y=dataset.iloc[:,-1:].values
# A matrix of all the dependent variablesX_train,X_test,y_train,y_test = train_test_split(X,Y, test_size=0.25,random_state=0)X_train[:5]
Primary there two things that can be done on a numerical feature :
1. Normalization:-
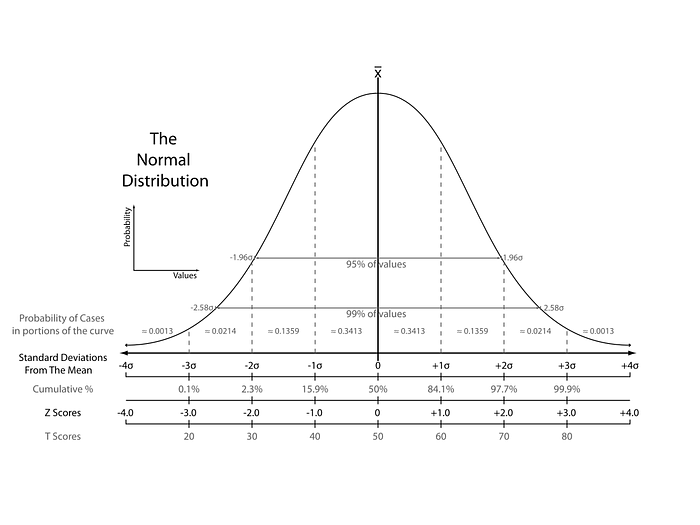
The point of normalization is to change your observations so that they can be described as a normal distribution.
Normal distribution (Gaussian distribution), also known as the bell curve, is a specific statistical distribution where a roughly equal observations fall above and below the mean, the mean and the median are the same, and there are more observations closer to the mean.
Note: The above definition is as per statistics. There are various types of normalization. In fact, min-max scaling can also be said to a type of normalization. In machine learning, the following are most commonly used.
There are mainly three normalization that can be done.
- Min-Max scaling:
min-max scaling is also a type of normalization, we transform the data such that the features are within a specific range e.g. [0, 1].
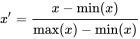
where x’ is the normalized value.
It can be easily seen that when x=min, then y=0, and When x=max, then y=1.
This means, the minimum value in X is mapped to 0 and the maximum value in X is mapped to 1. So, the entire range of values of X from min to max are mapped to the range 0 to 1.
Scaling is important in the algorithms such as support vector machines (SVM) and k-nearest neighbors (KNN) where distance between the data points is important. For example, in the dataset containing prices of products; without scaling, SVM might treat 1 USD equivalent to 1 INR though 1 USD = 65 INR.
import numpy as np
import seaborn as sns
import matplotlib.pyplot as plt
from sklearn.preprocessing import minmax_scale# set seed for reproducibility
np.random.seed(0)# generate 1000 data points randomly drawn from an exponential distribution
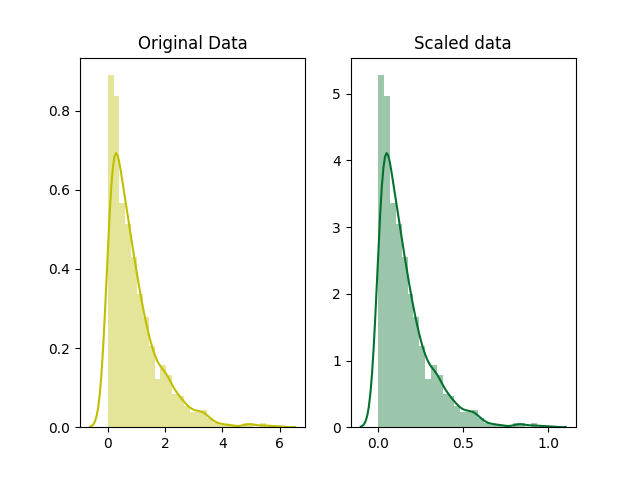
original_data = np.random.exponential(size = 1000)# mix-max scale the data between 0 and 1
scaled_data = minmax_scale(original_data)# plot both together to compare
fig, ax=plt.subplots(1,2)
sns.distplot(original_data, ax=ax[0], color='y')
ax[0].set_title("Original Data")
sns.distplot(scaled_data, ax=ax[1])
ax[1].set_title("Scaled data")
plt.show()
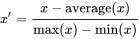
2. Mean Normalization:
Instead of using the minimum value to adjust , we use the mean of the feature.
It is used to rescale each sample. Each sample (i.e. each row of the data matrix) with at least one non zero component is rescaled independently of other samples so that its norm (l1 or l2) equals one.
Library used: Normalizer
from sklearn import preprocessing
X_train4 = preprocessing.Normalizer().fit(X_train).transform(X_train)
X_train4[:5]
or we can use following scipy model also as following shown in example:
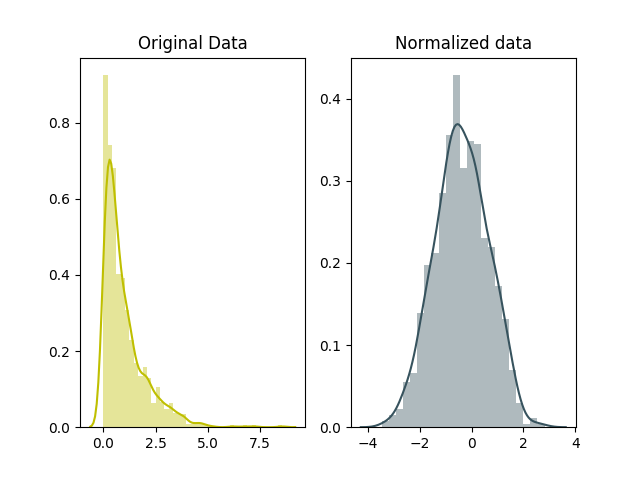
# for Box-Cox Transformation
from scipy import stats# normalize the exponential data with boxcox
normalized_data = stats.boxcox(original_data)# plot both together to compare
fig, ax=plt.subplots(1,2)
sns.distplot(original_data, ax=ax[0], color='y')
ax[0].set_title("Original Data")
sns.distplot(normalized_data[0], ax=ax[1])
ax[1].set_title("Normalized data")
plt.show()
In scaling, you’re changing the range of your data while in normalization you’re mostly changing the shape of the distribution of your data.
You need to normalize our data if you’re going use a machine learning or statistics technique that assumes that data is normally distributed e.g. t-tests, ANOVAs, linear regression, linear discriminant analysis (LDA) and Gaussian Naive Bayes.
Scaling vs. Normalization: What’s the difference? In both cases, you’re transforming the values of numeric variables so that the transformed data points have specific helpful properties. The difference is that, in scaling, you’re changing the range of your data while in normalization you’re changing the shape of the distribution of your data.
3. Standardization
Standardization (also called z-score normalization) transforms your data such that the resulting distribution has a mean of 0 and a standard deviation of 1. It’s the definition that we read in the last paragraph.
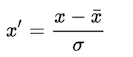
Where σ is the variance and x̄ is the mean.
It’s widely used in SVM, logistics regression and neural networks.
Library used: StandardScalar
from sklearn.preprocessing import StandardScaler
sc=StandardScaler()
X_train1=sc.fit_transform(X_train)
X_train1[:5]
2. Scaling to unit length
Another option that is widely used in machine-learning is to scale the components of a feature vector such that the complete vector has length one. This usually means dividing each component by the Euclidean length of the vector:
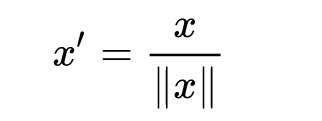
In some applications (e.g. Histogram features) it can be more practical to use the L1 norm (i.e. Manhattan Distance, City-Block Length or Taxicab Geometry) of the feature vector. This is especially important if in the following learning steps the Scalar Metric is used as a distance measure.
Applications
In stochastic gradient descent, feature scaling can sometimes improve the convergence speed of the algorithm. In support vector machines, it can reduce the time to find support vectors.
Conclusion
Rule of thumb I follow here is any algorithm that computes distance or assumes normality, scale your features!!!